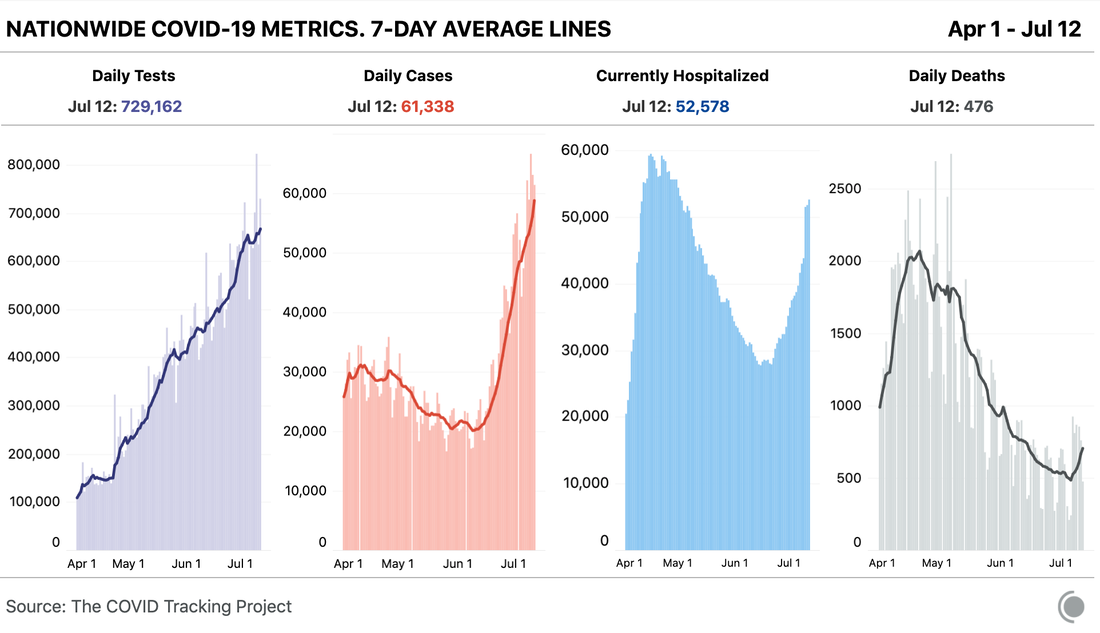
I mentioned in my last post that an increase in US virus deaths was expected this week after 2 months of steady decline.
Well, it's here (see bottom right graph).
Earlier, cases were increasing but deaths decreasing. This mismatch had multiple possible explanations, and this week's reversal supports the main one I wrote about - that we had been catching cases earlier than before. There were more hopeful explanations, such as that we had shielded vulnerable populations successfully.
The worse news is that this will probably grow for weeks. First, because we've got about 4 weeks of case increases baked in. Second, because many of the recent cases were from young people. Given the competence with which this has been handled, they have probably passed them on to older people, who will fall sick later and start to die later, but at much higher rates.
What a shitshow.
----------------
In response to a question about whether the daily death curve would eventually match the daily cases curve, implying about 4k deaths per day (after accounting for undertesting in April):
Mercifully the better projections don't foresee anything quite that extreme; it looks more like 4-6k per week rather than per day. I don't fully understand why that is, but I think it's largely because the age distribution of recent cases has skewed younger and younger. That has reversed recently (see this plot for Florida, for e.g. https://twitter.com/.../status/1283134585665200131/photo/1) and that will probably show up as an increase in another 3-4 weeks. Big uncertainties, as you know, especially because this involves forecasting policy and behaviour to some extent.
Those forecasts I mentioned: https://covid19-projections.com/us & https://viz.covid19forecasthub.org/. (The first shows deaths per day, the latter per week).
